The Deadliest Counties in the United States for Traffic Fatalities
One person in the U.S. is killed in a car accident every 12 minutes. With roughly forty thousand deaths caused every year by traffic accidents, which areas of the country have seen higher rates of fatal car accidents than others? The Convoy Car Shipping team sought out the U.S. counties with the highest rate of traffic fatalities between 2017 and 2022 using data from the Fatalities Analysis Reporting System (FARS). The National Highway Traffic Safety Administration (NHTSA) created FARS as a nationwide census to provide Congress and the American public with detailed reports of every fatal car accident on U.S. roads and highways since 1975. According to the FARS database, speeding is the leading cause of fatal car accidents, accounting for nearly one-third of all deadly auto accidents.
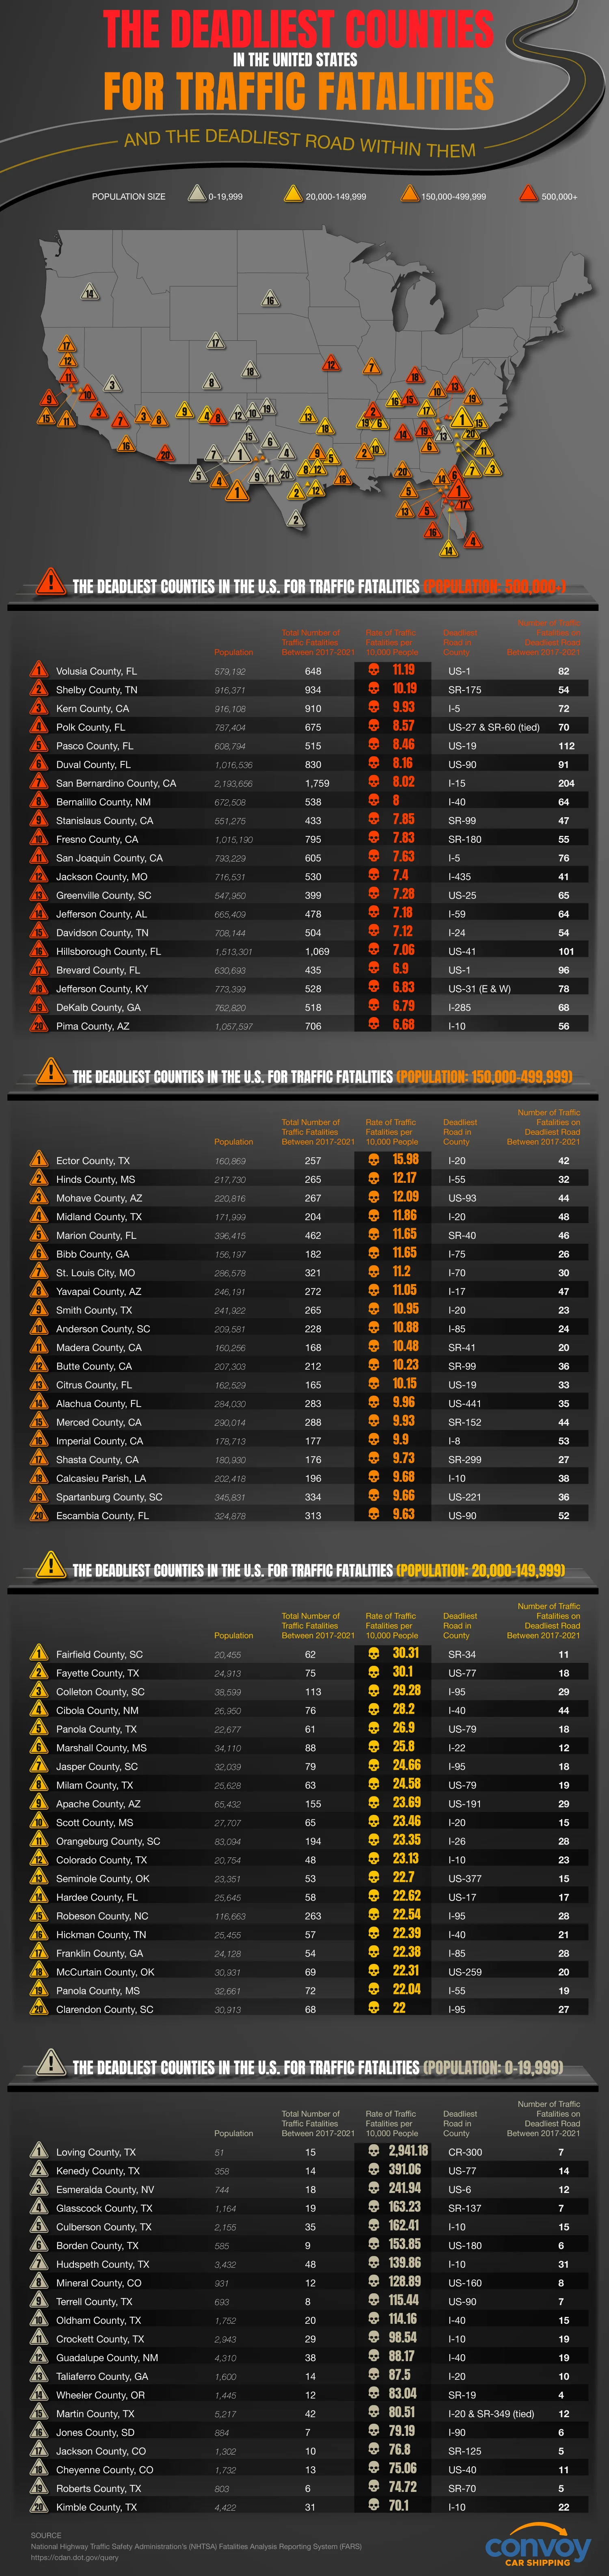
In addition to the counties with the most fatal car accidents per capita, our team also used the data to find the major U.S. highway or Interstate road in each county where the most fatalities took place during this five-year period. Explore the map below to see which eighty counties, big and small, were deemed to be the deadliest for traffic fatalities, along with some of the deadliest highways in the U.S. where a majority of the fatalities occurred.
Click to view the full-size infographic
Use the following embed code to post this infographic on your website:
What Are the Deadliest Counties for Traffic Fatalities?
Out of all the U.S. counties, one stands out as being the deadliest county for traffic fatalities on a per capita basis. Loving County is the least populous county in the U.S. with a population of just 51 people, but the 15 car accident deaths that have occurred in Loving County between 2017 and 2021 puts the rate of traffic fatalities per capita at an all-time high of 2,941 per 10,000 people. Almost half of the traffic fatalities in Loving County during this time took place on County Road 300.
Which large county has the highest rate of traffic fatalities? Volusia County, Florida has the most traffic fatalities per capita for the largest counties in America with over half a million residents. The county, which is home to Daytona Beach, had a rate of 11.19 traffic fatalities per 10,000 people. Between 2017 and 2022 648 people died in motor vehicle accidents in Volusia County, with 82 of the auto accident deaths having taken place on U.S. Highway 1.
Which County Has the Most Traffic Fatalities?
The U.S. county with the most auto deaths is Los Angeles County in southern California. The county had the most car deaths per year during each of the five years included in the study, which amounted to a total of 3,773 fatalities from car accidents. The county’s seat is Los Angeles, the second largest city in the U.S., and notorious for having some of the most congested traffic in the country with drivers said to lose 86 hours per year from sitting in rush hour traffic. Even with such a large number of traffic fatalities, Los Angeles County’s large population of almost 10 million people gives the county a low rate of traffic fatalities at just 3.88 fatalities per 10,000 people. The deadliest highway in Los Angeles County is Interstate 5 with 134 fatalities over the five-year period.
How Many People Are Killed in Traffic Accidents Each Year?
According to the National Highway Traffic Safety Administration, the number of traffic fatalities in the United States each year ranges between 35,000 and 45,000 fatalities. The NHTSA reported 42,939 fatalities from car accidents in 2021, reaching the highest number of motor vehicle traffic fatalities in fourteen years. The number of auto fatalities in 2021 was a 10.5% increase from the 38,824 traffic fatalities that occurred in 2020. The NHTSA states that speeding is a factor in almost one-third of all traffic fatalities and has launched a “Speeding Wrecks Lives” prevention campaign to try and lower the number of fatal car accidents.
Do you need to get a car across the country but you’re not sure how to get it there? That’s where we come in! We can ship your automobile across the country, from state to state, or even just door to door; with the option to expedite the process to get your vehicle there even faster. Our nationwide car shipping will save you the headache of getting stuck in traffic for hours, not to mention allowing you to avoid driving through some of the deadliest counties and roads in America. Learn how to ship a car and all of the popular and special services we offer for both individuals and businesses.
We’ll leave you with this simple quote to abide by to stay safe while driving on the road, “Leave sooner, drive slower, live longer.”
The Deadliest Counties in the U.S. for Traffic Fatalities (Population: 500,000+)
| County | Population | Total Number of Traffic Fatalities Between 2017-2021 | Rate of Traffic Fatalities per 10,000 People | Deadliest Road in County | Number of Traffic Fatalities on Deadliest Road Between 2017-2021 | |
| 1 | Volusia County, FL | 579,192 | 648 | 11.19 | US-1 | 82 |
| 2 | Shelby County, TN | 916,371 | 934 | 10.19 | SR-175 | 54 |
| 3 | Kern County, CA | 916,108 | 910 | 9.93 | I-5 | 72 |
| 4 | Polk County, FL | 787,404 | 675 | 8.57 | US-27 & SR-60 | 70 |
| 5 | Pasco County, FL | 608,794 | 515 | 8.46 | US-19 | 112 |
| 6 | Duval County, FL | 1,016,536 | 830 | 8.16 | US-90 | 91 |
| 7 | San Bernardino County, CA | 2,193,656 | 1759 | 8.02 | I-15 | 204 |
| 8 | Bernalillo County, NM | 672,508 | 538 | 8.00 | I-40 | 64 |
| 9 | Stanislaus County, CA | 551,275 | 433 | 7.85 | SR-99 | 47 |
| 10 | Fresno County, CA | 1,015,190 | 795 | 7.83 | SR-180 | 55 |
| 11 | San Joaquin County, CA | 793,229 | 605 | 7.63 | I-5 | 76 |
| 12 | Jackson County, MO | 716,531 | 530 | 7.40 | I-435 | 41 |
| 13 | Greenville County, SC | 547,950 | 399 | 7.28 | US-25 | 65 |
| 14 | Jefferson County | 665,409 | 478 | 7.18 | I-59 | 64 |
| 15 | Davidson County, TN | 708,144 | 504 | 7.12 | I-24 | 54 |
| 16 | Hillsborough County, FL | 1,513,301 | 1069 | 7.06 | US-41 | 101 |
| 17 | Brevard County, FL | 630,693 | 435 | 6.90 | US-1 | 96 |
| 18 | Jefferson County, KY | 773,399 | 528 | 6.83 | US-31 (E & W) | 78 |
| 19 | DeKalb County, GA | 762,820 | 518 | 6.79 | I-285 | 68 |
| 20 | Pima County, AZ | 1,057,597 | 706 | 6.68 | I-10 | 56 |
The Deadliest Counties in the U.S. for Traffic Fatalities (Population: 150,000-499,999)
| County | Population | Total Number of Traffic Fatalities Between 2017-2021 | Rate of Traffic Fatalities per 10,000 People | Deadliest Road in County | Number of Traffic Fatalities on Deadliest Road Between 2017-2021 | |
| 1 | Ector County, TX | 160,869 | 257 | 15.98 | I-20 | 42 |
| 2 | Hinds County, MS | 217,730 | 265 | 12.17 | I-55 | 32 |
| 3 | Mohave County, AZ | 220,816 | 267 | 12.09 | US-93 | 44 |
| 4 | Midland County, TX | 171,999 | 204 | 11.86 | I-20 | 48 |
| 5 | Marion County, FL | 396,415 | 462 | 11.65 | SR-40 | 46 |
| 6 | Bibb County, GA | 156,197 | 182 | 11.65 | I-75 | 26 |
| 7 | St. Louis city, MO | 286,578 | 321 | 11.20 | I-70 | 30 |
| 8 | Yavapai County, AZ | 246,191 | 272 | 11.05 | I-17 | 47 |
| 9 | Smith County, TX | 241,922 | 265 | 10.95 | I-20 | 23 |
| 10 | Anderson County, SC | 209,581 | 228 | 10.88 | I-85 | 24 |
| 11 | Madera County, CA | 160,256 | 168 | 10.48 | SR-41 | 20 |
| 12 | Butte County, CA | 207,303 | 212 | 10.23 | SR-99 | 36 |
| 13 | Citrus County, FL | 162,529 | 165 | 10.15 | US-19 | 33 |
| 14 | Alachua County, FL | 284,030 | 283 | 9.96 | US-441 | 35 |
| 15 | Merced County, CA | 290,014 | 288 | 9.93 | SR-152 | 44 |
| 16 | Imperial County, CA | 178,713 | 177 | 9.90 | I-8 | 53 |
| 17 | Shasta County, CA | 180,930 | 176 | 9.73 | SR-299 | 27 |
| 18 | Calcasieu Parish, LA | 202,418 | 196 | 9.68 | I-10 | 38 |
| 19 | Spartanburg County, SC | 345,831 | 334 | 9.66 | US-221 | 36 |
| 20 | Escambia County, FL | 324,878 | 313 | 9.63 | US-90 | 52 |
The Deadliest Counties in the U.S. for Traffic Fatalities (Population: 20,000-149,999)
| County | Population | Total Number of Traffic Fatalities Between 2017-2021 | Rate of Traffic Fatalities per 10,000 People | Deadliest Road in County | Number of Traffic Fatalities on Deadliest Road Between 2017-2021 | |
| 1 | Fairfield County, SC | 20,455 | 62 | 30.31 | SR-34 | 11 |
| 2 | Fayette County, TX | 24,913 | 75 | 30.10 | US-77 | 18 |
| 3 | Colleton County, SC | 38,599 | 113 | 29.28 | I-95 | 29 |
| 4 | Cibola County, NM | 26,950 | 76 | 28.20 | I-40 | 44 |
| 5 | Panola County, TX | 22,677 | 61 | 26.90 | US-79 | 18 |
| 6 | Marshall County, MS | 34,110 | 88 | 25.80 | I-22 | 12 |
| 7 | Jasper County, SC | 32,039 | 79 | 24.66 | I-95 | 18 |
| 8 | Milam County, TX | 25,628 | 63 | 24.58 | US-79 | 19 |
| 9 | Apache County, AZ | 65,432 | 155 | 23.69 | US-191 | 29 |
| 10 | Scott County, MS | 27,707 | 65 | 23.46 | I-20 | 15 |
| 11 | Orangeburg County, SC | 83,094 | 194 | 23.35 | I-26 | 28 |
| 12 | Colorado County, TX | 20,754 | 48 | 23.13 | I-10 | 23 |
| 13 | Seminole County, OK | 23,351 | 53 | 22.70 | US-377 | 15 |
| 14 | Hardee County, FL | 25,645 | 58 | 22.62 | US-17 | 17 |
| 15 | Robeson County, NC | 116,663 | 263 | 22.54 | I-95 | 28 |
| 16 | Hickman County, TN | 25,455 | 57 | 22.39 | I-40 | 21 |
| 17 | Franklin County, GA | 24,128 | 54 | 22.38 | I-85 | 28 |
| 18 | McCurtain County, OK | 30,931 | 69 | 22.31 | US-259 | 20 |
| 19 | Panola County, MS | 32,661 | 72 | 22.04 | I-55 | 19 |
| 20 | Clarendon County, SC | 30,913 | 68 | 22.00 | I-95 | 27 |
The Deadliest Counties in the U.S. for Traffic Fatalities (Population: 0-19,999)
| County | Population | Total Number of Traffic Fatalities Between 2017-2021 | Rate of Traffic Fatalities per 10,000 People | Deadliest Road in County | Number of Traffic Fatalities on Deadliest Road Between 2017-2021 | |
| 1 | Loving County, TX | 51 | 15 | 2,941.18 | CR-300 | 7 |
| 2 | Kenedy County, TX | 358 | 14 | 391.06 | US-77 | 14 |
| 3 | Esmeralda County, NV | 744 | 18 | 241.94 | US-6 | 12 |
| 4 | Glasscock County, TX | 1,164 | 19 | 163.23 | SR-137 | 7 |
| 5 | Culberson County, TX | 2,155 | 35 | 162.41 | I-10 | 15 |
| 6 | Borden County, TX | 585 | 9 | 153.85 | US-180 | 6 |
| 7 | Hudspeth County, TX | 3,432 | 48 | 139.86 | I-10 | 31 |
| 8 | Mineral County, CO | 931 | 12 | 128.89 | US-160 | 8 |
| 9 | Terrell County, TX | 693 | 8 | 115.44 | US-90 | 7 |
| 10 | Oldham County, TX | 1,752 | 20 | 114.16 | I-40 | 15 |
| 11 | Crockett County, TX | 2,943 | 29 | 98.54 | I-10 | 19 |
| 12 | Guadalupe County, NM | 4,310 | 38 | 88.17 | I-40 | 19 |
| 13 | Taliaferro County, GA | 1,600 | 14 | 87.50 | I-20 | 10 |
| 14 | Wheeler County, OR | 1,445 | 12 | 83.04 | SR-19 | 4 |
| 15 | Martin County, TX | 5,217 | 42 | 80.51 | I-20 & SR-349 | 12 |
| 16 | Jones County, SD | 884 | 7 | 79.19 | I-90 | 6 |
| 17 | Jackson County, CO | 1,302 | 10 | 76.80 | SR-125 | 5 |
| 18 | Cheyenne County, CO | 1,732 | 13 | 75.06 | US-40 | 11 |
| 19 | Roberts County, TX | 803 | 6 | 74.72 | SR-70 | 5 |
| 20 | Kimble County, TX | 4,422 | 31 | 70.10 | I-10 | 22 |
This page was last updated by Marc Gregory